MBTA Drivers Getting Safer
Posted on March 1, 2010
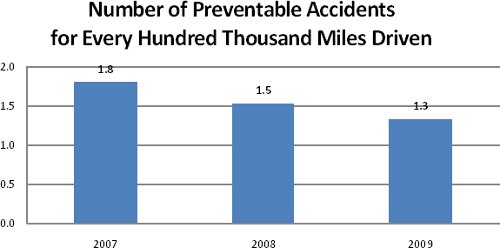
The safety record of MBTA bus drivers improved again in 2009, as it had in 2008. The total number of accidents went down both years. By the most meaningful statistic, (the number of preventable accidents per number of miles traveled), the MBTA averaged 1.3 accidents for every one hundred thousand miles in 2009 – a drop of more than 25% compared to 1.8 in 2007.
An accident is called “preventable” if it could have been averted by actions by the bus driver; in the vast majority (83%) of accidents last year involving MBTA buses the bus driver was not at fault and could not have prevented the accident. In other words, a car driver is four times more likely to make an error leading to an accident with a bus than a bus driver is likely to make an error leading to an accident with a car. The MBTA’s accident rate is the equivalent of a car driver going an average of six years between accidents – while managing 40-to-60-foot-long vehicles, constantly pulling into and out of stops, operating on congested streets, and taking care of customers inside the bus.
The MBTA performs routine safety audits of routes and stops to find and address potential safety hazards, and rides buses to covertly observe operators that have been reported as operating in a manner not consistent with MBTA safety rules and regulations. The MBTA is always looking for ways to improve safety. Some steps taken recently include a new operator recertification program, a new “bus simulator” simulated driving environment to improve training, and a zero-tolerance policy on possession of cell phones and electronic devices.
More Information
Media Contact Information
For all queries and comments, please contact: